
Welcome to Wing’s fifth annual V21 study, which examines early stage financing dynamics amongst the industry’s highest quality startups. As with prior years, we have updated the V21 dataset with an additional year’s worth of data. We have also refined selected aspects of our methodology and re-downloaded and re-analyzed the dataset back to 2010 for consistency’s sake. The curated V21 dataset now captures the details of 9,007 financings at 4,485 companies invested in by at least one of 21 elite venture capital firms across 12 years.
In last year’s V21 study, we observed the “sharpest of recoveries” from the onset of the Covid-19 pandemic in the first quarter of 2020. Our study banner image was the Wall Street Bull. Seed financings experienced little-to-no negative impact from one quarter to the next during 2020, and Series A’s and Series B’s experienced initial quarterly drops followed by rebounds to new all-time highs by the fourth quarter of 2020.
If 2020 was the year of bull recovery, 2021 was the year of the Cannonball Effect. Series A’s and Series B’s financing sizes and pre-money valuations increased to new all-time highs. In addition, the growth rates were new all-time highs as well. Specifically:
- The median Series A financing grew to a new high of $18.0M in 2021, representing a new high annual growth rate of 38%.
- The median Series B financing grew to a new high of $40.0M in 2021, representing a new high annual growth rate of 33%.
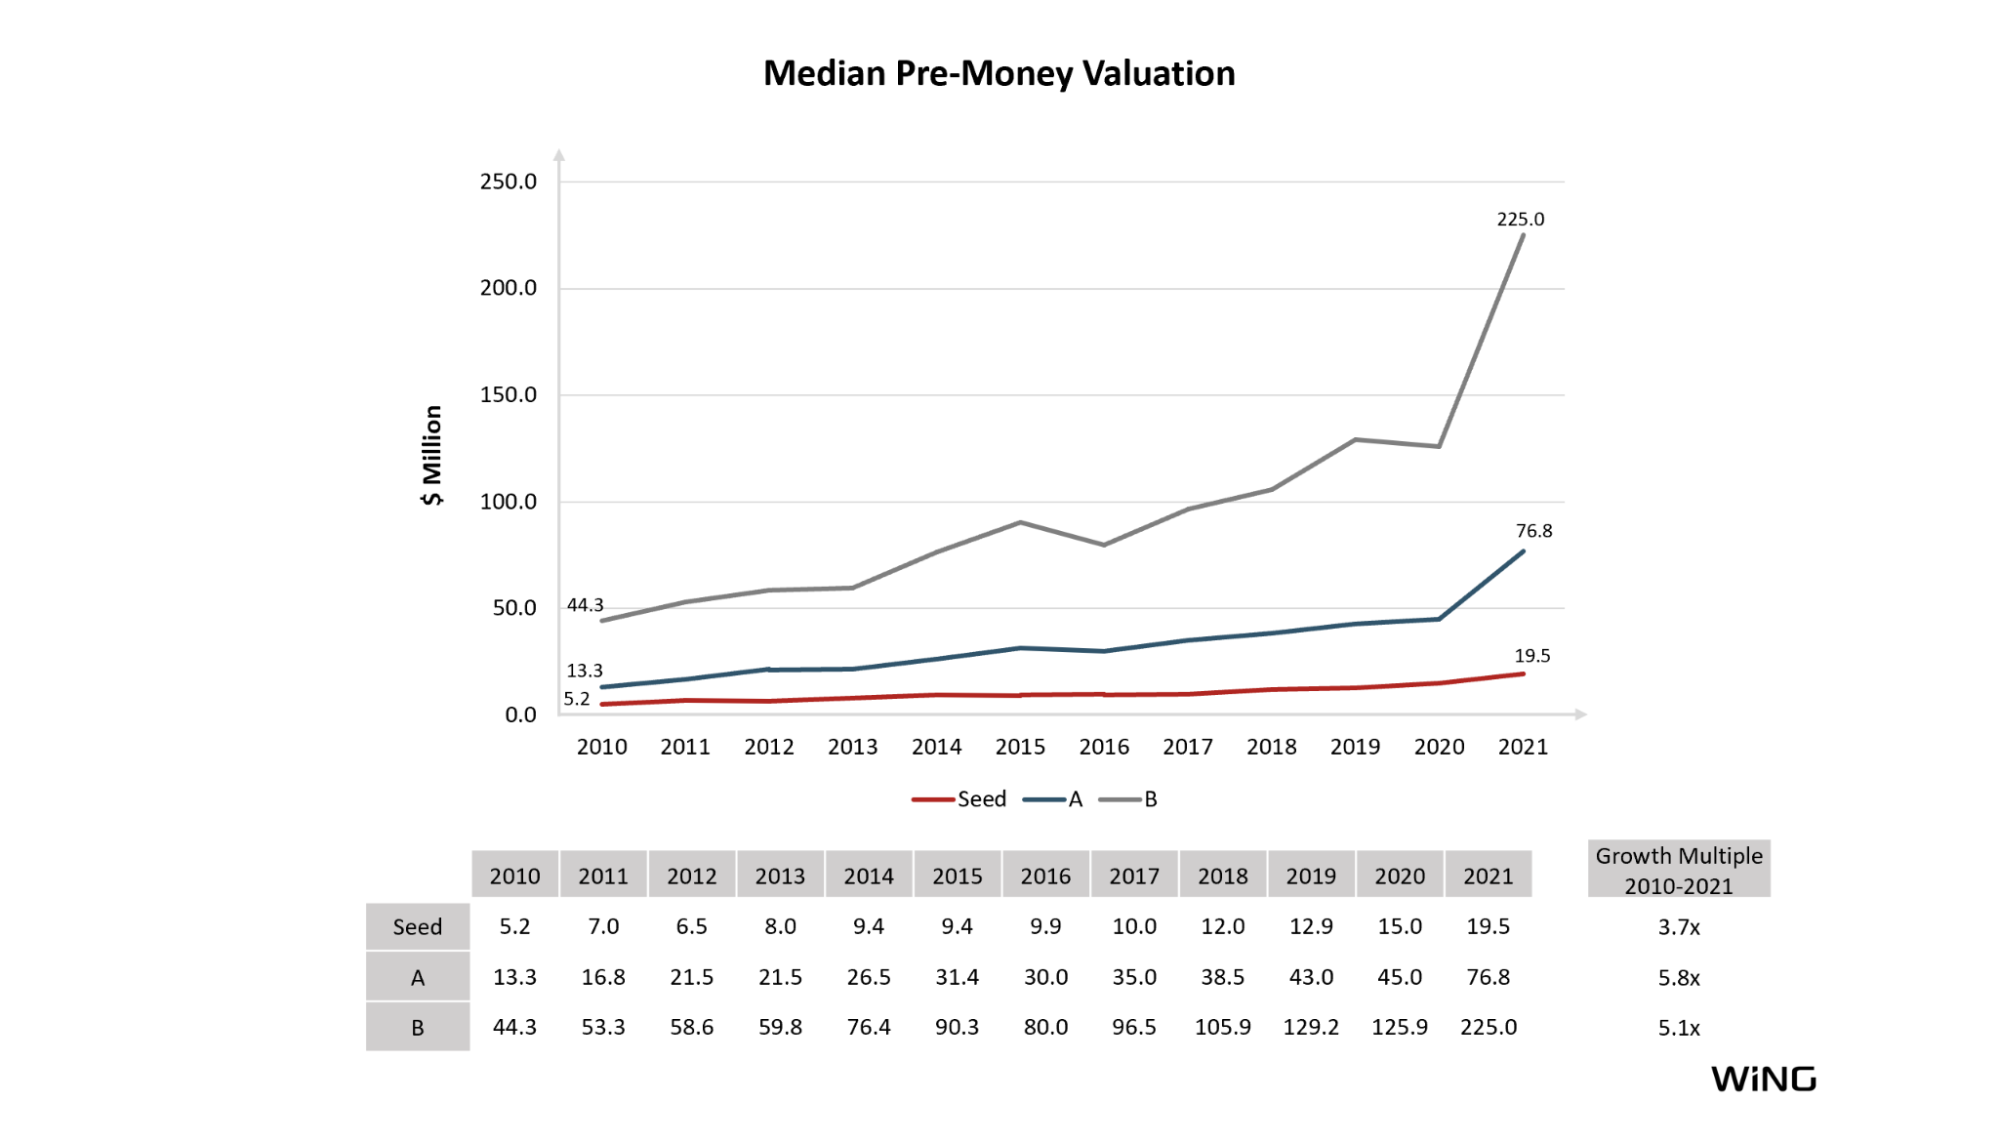
- The median Series A pre-money valuation grew to a new high of $76.8M in 2021, representing a new high annual growth rate of 71%.
- The median Series B pre-money valuation grew to a new high of $225.0M in 2021, representing a new high annual growth rate of 79%.
Although some of these figures may moderate over time as more companies become V21 companies and their longitudinal financing histories are added to the V21 dataset, it is clear that 2021 represented unprecedented growth in the financing metrics for the highest quality V21 startups.

So why are the 2021 numbers so unprecedented? We posted last month our study on the Cannonball Effect, in which non-traditional venture investors from the public and private equity markets are investing in early stage venture capital and are having an outsized impact on financing dynamics. As one might expect, the Cannonball Effect is having a material impact on V21 companies.
In the post, we introduced a cohort of 10 investment firms leading the Cannonball Effect. This cohort of 10 firms had 25 first-time Series A’s in V21 companies in 2021, as compared to 2 in 2019 and 7 in 2020. The cohort had 53 first-time Series B’s in V21 companies in 2021, as compared to 7 in 2019 and 10 in 2020. Tiger continues to lead the pack. Tiger represented 60% of the first-time Series A’s (15 of 25) and 58% of the first-time Series B’s (31 of 53) in 2021.

Executive Summary
Here is a summary of our findings.
Seed financings:
- Companies continue to consume more Seed capital.
- The median Seed financing increased to $4.5M in 2021, up 13% from 2020.
- The median Seed pre-money valuation increased to $19.5M in 2021, up 30% from 2020.
- The average company raising Seed’s had raised $1.1M in 2021, up 40% from 2020.
Series A financings:
- As discussed above, Series A’s had pronounced growth driven by the Cannonball Effect.
- The median Series A financing increased to $18.0M in 2021, up 38% from 2020.
- The median Series A pre-money valuation increased to $76.8M in 2021, up 71% from 2020.
- The average company raising Series A’s had raised $5.0M in 2021, up 22% from 2020.
- 45% of Series A’s were $20 million or greater in 2021, as compared to 22% in 2020. “Jumbo Series A’s” are closer to the norm rather than the exception now.
Series B financings:
- Series B’s also had pronounced growth driven by the Cannonball Effect.
- The median Series B financing increased to $40.0M in 2021, up 33% from 2020.
- The median Series B pre-money valuation increased to $225.0M in 2021, up 79% from 2020.
- The average company raising Series B’s had raised $30.3M in 2021, up 63% from 2020.
The Findings
1. Size of Financings
The size of early stage financings increased significantly in 2021 for A’s and B’s, driven by the robust financing environment for startups and the Cannonball Effect in A’s and B’s. The median Series A financing was $18.0M in 2021, up 38% on the year, and the median Series B financing was $40.0M in 2021, up 33% on the year. Meanwhile, the median Seed financing increased to $4.5M in 2021, up 13% on the year.
The more rapid growth of the Series A financing size drove an increase in the Seed-to-A multiple to 4.0x in 2021 from 3.3x in 2020. The A-to-B multiple remained relatively flat at 2.2x in 2021 as compared to 2.3x in 2020.
The “cross-class” comparisons continue to demonstrate our thesis that Seed is the new A and that A is the new B. The median 2021 Series A financing is 57% higher than the median 2010 Series B financing, and the median 2021 Seed financing is only 2% smaller than the median 2010 Series A financing.


Two years ago we started tracking the number of “Jumbo Series A’s”, which we defined as $20 million or greater. This used to be a rare occurrence. From 2010 to 2013, $20M+ Series A financings represented between 4% and 6% of all Series A financings. The number of $20M+ Series A financings ranged from 6 to 12 per year from 2010 to 2013.
Jumbo Series A’s increased significantly from 2014 to 2020 and then soared from 2020 to 2021. In 2021, $20M+ Series A financings represented 45% - almost half - of all Series A financings. The number of $20M+ Series A financings grew to 195 in 2021, up 3.1x from just the prior year of 62 in 2020. $20M+ Series A’s are closer to the norm, rather than the exception, for V21 companies.
A methodology note–the above Jumbo Series A’s figures are not affected by growth equity financings. We specifically remove growth equity financings, e.g. in mature bootstrapped companies or in company spinouts–from the V21 dataset, so that the V21 dataset reflects venture-backed startups only.

2. Valuations
The pre-money valuations also increased significantly in 2021 for A’s and B’s, driven again by the financing environment and the Cannonball Effect for A’s and B’s. The median pre-money valuation for A’s was $76.8M in 2021, up 71% from 2020, and the median pre-money valuation for B’s was $225.0M in 2021, up 78% from 2020. Meanwhile, the median pre-money valuation for Seed’s increased to $19.5M in 2021, up 30% from 2020.
A “Rule of 3x” (pre-money to pre-money between rounds) had been consistent for the past 5+ years. However, in 2021 the pre-money Seed to pre-money A was higher at 3.9x, driven by A’s as the entry point for Cannonball Effect financings.
Another methodology note–some of the 2021 figures will moderate in change over time as 1) more 2021 financings become publicly known over time and 2) more companies become V21 companies over time and their longitudinal financing histories are added to the V21 dataset.

3. Sequential Number of Rounds
As we observed in last year’s analysis, the average “sequential number of rounds” appears to have leveled off for each round. The average Seed financing was round number 1.9 in 2021, unchanged from each of the prior 5 years. The average Series A financing was round number 2.9 in 2021, a slight increase from 2.8 in 2020. The average Series B financing was round number 4.0 in 2021, a slight decrease from 4.1 in 2020.

4. Cumulative Capital Raised “Prior-to”
The cumulative capital raised prior to a particular financing continued to increase massively in 2021, commensurate with the spike in the financing environment and the Cannonball Effect. V21 companies raising Seed financings had raised an average of $1.1M in 2021, up 40% from 2020. V21 companies raising Series A’s had raised an average of $5.0M in 2021, up 22% from 2020. And, V21 companies raising Series B’s had raised an average of $30.3M in 2021, up 63% in 2020.

5. Years Since Founding
“Years Since Founding” decreased significantly for Series B’s in 2021, due to companies raising larger capital rounds at lower ARR levels through Cannonball Effect financings. The median years since founding for Series B’s was 3.90 in 2021, down 10% from 4.33 in 2020. Meanwhile, the median years since founding for Seed’s was 1.33 in 2021, slightly up from 1.32 in 2020, and the median years since founding for Series A’s was 2.64 in 2021, slightly up from 2.58 in 2020.

6. Revenue Generation
The proportion of companies that are revenue-generating have plateaued at historically and stunningly high levels. 81% of companies raising Seed financings in 2021 were generating revenue, up slightly from 79% in 2020. 91% of companies raising Series A’s in 2021 were generating revenues, down slightly from 92% in 2020. 96% of companies raising Series B’s in 2021 were generating revenues, unchanged from 96% in 2020. By comparison, the percentage of companies raising Seed’s, Series A’s, and Series B’s that were revenue-generating were 14%, 30%, and 56%, respectively, in 2010. Revenues–even if only $10K or $20K per month–are a prerequisite for most Seed’s and almost all Series A’s today.

7. Time Machine Analysis
As we introduced in prior studies, it is instructive to search for “look-alikes” between current-era financings and predecessor deals from prior years.
Last year, we observed that a 2020 Seed looked like a 2010 Series A and that a 2020 Series A looked like a 2010 Series B. This year, the cross-class trends continued.
2021 Seed vs 2010 Series A:
- Pre-Money Valuation: $19.5M (Seed) vs. $13.3M (Series A)
- Size: $4.5M vs $4.6M
- Sequential Round Number: 1.9 vs. 1.5
2021 Series A vs 2010 Series B:
- Pre-Money Valuation: $76.8M (Series A) vs. $44.3M (Series B)
- Size: $18.0M vs. $11.5M
- Sequential Round Number: 2.9 vs. 2.7

Methodology Note–Updating the V21 Dataset
Each year, we update the V21 dataset and make improvements to the analysis. This year, we naturally added a new year’s worth of data, which impacts some of the prior years as the longitudinal financing histories of newly included companies are added to the sample. We continued to refine the process of selecting and removing multiple Series A’s and Series B’s in PitchBook. Further, as with prior years’ updates, we re-downloaded and re-ran the entire analysis back to 2010 for consistency’s sake. For readers unfamiliar with the V21, a quick recap of the motivation and methodology is here in the 2020 study.
Conclusion
So, will the Cannonball Effect continue to drive unprecedented growth, or will headwinds from interest rate increases, geopolitical conflicts, and other uncertainties drive a reset to a new phase in the venture capital cycle in 2022? In our conversations with some of the top non-traditional investors that have been leading the charge into venture, we have learned that it’s not as simple as just redirecting activity and capital back into the public or private equity markets, where value now looks a lot better than it did a couple months ago. The cash these investors are deploying into venture capital deals is less fungible than you might think. It often comes from dedicated vehicles managed by dedicated teams with specific mandates. While this can change across fund cycles, it has some stickiness in the short to medium term.
Some early data from firms like Carta show the beginning signs of a reset, and the expectations among the ecosystem of participants seem to forewarn of a slowing. Whether this is a new long-term reality or a temporary pause is something we will be watching closely as the year plays out.


